Difference between revisions of "VRS - Create a Real Time Report"
SupportAdmin (talk | contribs) |
SupportAdmin (talk | contribs) |
||
| Line 1: | Line 1: | ||
A Real Time Report is created so that it can appear in cell within a panel. The advantage to this is that the panel does not have to run calculations as the reporting software does that in creating the report. This will help with processing time and make the panels more responsive. The graphics on a report are more detailed that what can be created within a panel. | A Real Time Report is created so that it can appear in cell within a panel. The advantage to this is that the panel does not have to run calculations as the reporting software does that in creating the report. This will help with processing time and make the panels more responsive. The graphics on a report are more detailed that what can be created within a panel. | ||
=Instructions= | =Instructions= | ||
Revision as of 17:52, 31 July 2018
A Real Time Report is created so that it can appear in cell within a panel. The advantage to this is that the panel does not have to run calculations as the reporting software does that in creating the report. This will help with processing time and make the panels more responsive. The graphics on a report are more detailed that what can be created within a panel.
Instructions
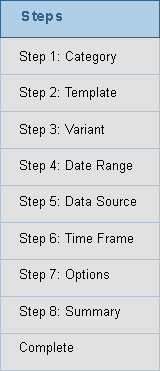
1. Run a report as you normally would - complete all 8 steps.
2. After the report has run and it is presented in your web browser - click on the VRS tab that you clicked Run in.
3. Select the "Convert to a Real Time Report" button.
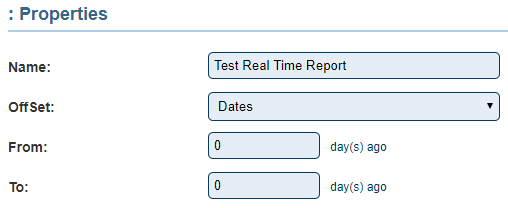
4. The following options are available on the Properties page:
    a. Name - enter a name for this Real Time Report.
    b. Offset - select the type of time offset for the report.
         i. Dates - enter days in From & To field.
         ii Weeks - enter weeks in From & To field.
         iii. Months - enter months in From & To field.
         iv. Years - enter years in From & To field.
    c. From - enter a day, week, month or year for when the report will start.
    d. To - enter a day, week, month or year for when the report will end.
NOTE: In our example we selected From 0 To 0 which will run the report for now within the parameters setup in the report. If you were to select From 1 To 0 it would run the report from yesterday through now within the parameters setup in the report.
5. Click on the Next button when all fields are filled in.
6. Click on the Add Time Slot button. Multiple time slots can be added.
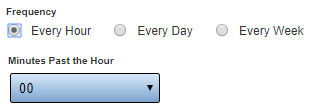
7. The first Frequency available is to run the report every hour.
    a. Frequency - select Every Hour.
    b. Minutes Past the Hour - use the down arrow to select the time in the hour to run the report.
NOTE: In our example we select 15 which means at 15 minutes past every hour the report will run/refresh.
8. The second Frequency available is to run the report every day.
    a. Frequency - select Every Day.
    b. Time -  click on the Clock icon and select the time you want to run the report.
    c. Days - select the day(s) you want to run/refresh the report.
NOTE: In our example we set the report to run every Monday, Tuesday, Wednesday, Thursday & Friday at 7:00 am in the morning.
9. The third Frequency Available is to run the report every Week.
    a. Frequency - select Every Week.
    b. Time - click on the Clock icon and select the time you want to run the report.
    c. Day of Week - select the day(s) of the week you want to run/refresh the report.
NOTE: In our example we set the report to run every week on Monday at 9:00 am in the morning.
10. When all time slots are added click on the Save & Exit button.
11. The Real Time Reports page will load. You will see the report that was created show in the list.


