Difference between revisions of "VPIV Incidents Tag"
Jump to navigation
Jump to search

SupportAdmin (talk | contribs) |
SupportAdmin (talk | contribs) |
||
| (10 intermediate revisions by the same user not shown) | |||
| Line 1: | Line 1: | ||
{|style="background:transparent; color:black" border="0" height="230" align="center" valign="bottom" | |||
|+style="background:transparent| | |||
|-align="center" | |||
| | |||
|[[Image:CallUsBtn.png|Call Now 858-677-6766]] | |||
| | |||
|[[Image:SubmitTckBtn.png|link=https://www.versacall.com/customer-support/service-ticket]] | |||
| | |||
|[[Image:EmailUsBtn.png|link=mailto:support@versacall.com?Subject=Help%20Needed%20Wiki&body=Type%20Message%20Here]] | |||
|- | |||
| | |||
| | |||
|} | |} | ||
<BR> | |||
<div style="box-shadow: 0 0 10px 0 #00719e inset; border-radius:5px; padding:10px;"> | |||
<span style="color:#00719e; font-family: Helvetica; font-size:150%; font-variant: small-caps; padding-left:20px;">'''General Information'''</span> | |||
:*This tag is used to tally up the number of times one or more monitoring points have been activated. | |||
:*The time frame for the tally can be set to specific intervals. | |||
</div> | |||
<BR> | |||
<div style="box-shadow: 0 0 10px 0 #00719e inset; border-radius:5px; padding:10px;"> | |||
<span style="color:#00719e; font-family: Helvetica; font-size:150%; font-variant: small-caps; padding-left:20px;">'''Basic Functionality'''</span> | |||
:*After selecting to add a Number of Incidents tag, the user will see the following Window: | |||
<div style="padding-left:30px;"> | |||
<gallery widths=545px heights=350px> | |||
Image:Tag-Incidents-1.png|link=VPIV Incidents Tag | |||
< | |||
< | |||
= | |||
= | |||
<gallery widths= | |||
</gallery> | </gallery> | ||
</div> | |||
::*'''Name''' – enter a name. | |||
::*'''Functionality''' – select Number of Incidents. | |||
::*'''Active Only''' - select this option to only show a Duration when the Monitoring Point is active. | |||
::*'''Time Period''' - this field will provide access to the following options: | |||
::::*'''Current Shift''' - shows duration when a shift is active. After the current shift has elapsed, the duration will reset to zero. | |||
::::*'''24 Hour''' - show duration over a 24 hour period. After the period has elapsed, the duration will reset to zero. | |||
::::*'''Specific Shift''' - only shows the duration for the specific shift selected. After the shift has elapses, the duration will reset to zero. | |||
::::*'''Span''' - allows the user to manually set a period of time. After the time period has elapsed, the duration will reset to zero. | |||
::*'''Data Source - Monitoring Point''' - this field allows the user to select what to tally. By default the field will be set to Monitoring Point, the following options are available. | |||
::::*'''Monitoring Point''' - allows the user to select a specific monitoring point on a device. | |||
::::*'''Filter Group''' - allows the user to select a specific filter group setup in the system. | |||
::::*'''Device''' - allows the user to select a specific device setup in the system. Selecting this option will give at total number of incidents for the all monitoring points setup on the device. | |||
::*'''Data Source - Device''' - this field will show when Monitoring Point or Device has been selected from thee options above. Allows the user to select the specific device. | |||
::*'''Data Source - Monitoring Point''' - this field will only show when Monitoring Point has been selected from the options above. Allows the user to select the specific monitoring point on the selected device. | |||
<gallery widths= | ::*'''Data Source - Group''' - this field will only show when Filter Group has been selected from the options above. Allows the user to select the specific filter group. | ||
::*'''Result''' - Integer is the only option available. | |||
<BR> | |||
:<span style="color:#90A4AE; font-size:130%"> '''Example - Monitoring Point''' </span> | |||
:*Returns the total Number of Incidents for Station 1 - Maintenance Calls during the Current Shift. | |||
<div style="padding-left:30px;"> | |||
<gallery widths=545px heights=350px> | |||
Image:Tag-Incidents-2.png|link=VPIV Incidents Tag | |||
</gallery> | </gallery> | ||
</div> | |||
<BR> | |||
:<span style="color:#90A4AE; font-size:130%"> '''Example - Filter Group''' </span> | |||
:*Returns the total Number of Incidents, for the Maintenance Filter Group, for First Shift on the Current Day. | |||
<div style="padding-left:30px;"> | |||
<gallery widths=545px heights=376px> | |||
Image:Tag-Incidents-3.png|link=VPIV Incidents Tag | |||
= | |||
<gallery widths= | |||
</gallery> | </gallery> | ||
</div> | |||
<BR> | |||
:<span style="color:#90A4AE; font-size:130%"> '''Example - Device''' </span> | |||
:*Returns the total Number of Incidents, on all Calls, for Station 1 in a 24 Hour period. | |||
<div style="padding-left:30px;"> | |||
<gallery widths=545px heights=317px> | |||
Image:Tag-Incidents-4.png|link=VPIV Incidents Tag | |||
= | |||
<gallery widths= | |||
</gallery> | </gallery> | ||
</div> | |||
</div> | |||
<BR> | |||
<div style="box-shadow: 0 0 10px 0 #00719e inset; border-radius:5px; padding:10px; padding-left:20px;"> | |||
<span style="color:#00719e; font-family: Helvetica; font-size:150%; font-variant: small-caps; padding-left:10px;">'''Keyword Search'''</span> | |||
{|style="margin:auto;" | |||
{|class="wikitable" style="align:center; width:600px;" | |||
< | |||
</ | |||
< | |||
{|style="margin: auto; | |||
{| class=" | |||
|- | |- | ||
!<span style="color:#0054a6; font-size:120%"><big>Type Subject or Key Word to Query Archives</big></span> | |||
|- | |- | ||
| | |<inputbox>type=search</inputbox> | ||
|} | |} | ||
|} | |} | ||
| | </div> | ||
| | <br> | ||
[[File:VC Footer.png|center|link=Main Page]] | |||
{|style="background:transparent; color:black" border="0" height="200" align="center" valign="bottom" cellpadding=10px cellspacing=10px | |||
|+style="background:transparent| | |||
|-align="center" | |||
| | |||
|[[File:LinkedIn.png|Follow Us On LinkedIn|link=https://www.linkedin.com/company/versacall/]] | |||
| | |||
|[[File:BlogIcon.png|View our Blog|link=https://www.versacall.com/blog/]] | |||
|} | |} | ||
Latest revision as of 21:30, 31 October 2023

|

|

|
General Information
- This tag is used to tally up the number of times one or more monitoring points have been activated.
- The time frame for the tally can be set to specific intervals.
Basic Functionality
- After selecting to add a Number of Incidents tag, the user will see the following Window:
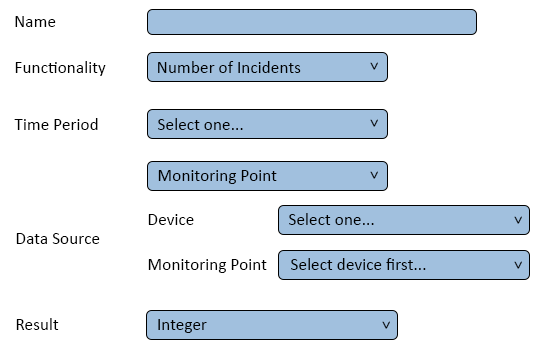
- Name – enter a name.
- Functionality – select Number of Incidents.
- Active Only - select this option to only show a Duration when the Monitoring Point is active.
- Time Period - this field will provide access to the following options:
- Current Shift - shows duration when a shift is active. After the current shift has elapsed, the duration will reset to zero.
- 24 Hour - show duration over a 24 hour period. After the period has elapsed, the duration will reset to zero.
- Specific Shift - only shows the duration for the specific shift selected. After the shift has elapses, the duration will reset to zero.
- Span - allows the user to manually set a period of time. After the time period has elapsed, the duration will reset to zero.
- Data Source - Monitoring Point - this field allows the user to select what to tally. By default the field will be set to Monitoring Point, the following options are available.
- Monitoring Point - allows the user to select a specific monitoring point on a device.
- Filter Group - allows the user to select a specific filter group setup in the system.
- Device - allows the user to select a specific device setup in the system. Selecting this option will give at total number of incidents for the all monitoring points setup on the device.
- Data Source - Device - this field will show when Monitoring Point or Device has been selected from thee options above. Allows the user to select the specific device.
- Data Source - Monitoring Point - this field will only show when Monitoring Point has been selected from the options above. Allows the user to select the specific monitoring point on the selected device.
- Data Source - Group - this field will only show when Filter Group has been selected from the options above. Allows the user to select the specific filter group.
- Result - Integer is the only option available.
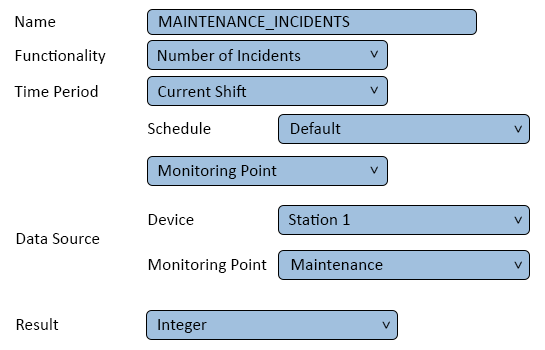
- Example - Monitoring Point
- Returns the total Number of Incidents for Station 1 - Maintenance Calls during the Current Shift.
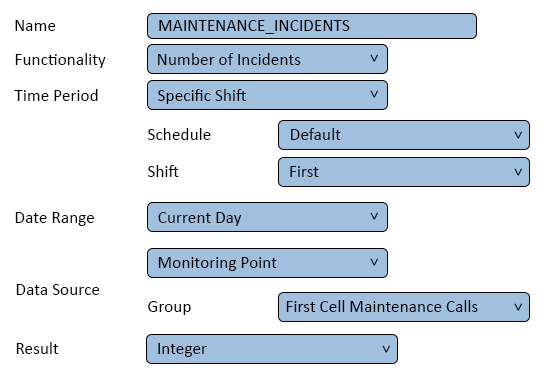
- Example - Filter Group
- Returns the total Number of Incidents, for the Maintenance Filter Group, for First Shift on the Current Day.
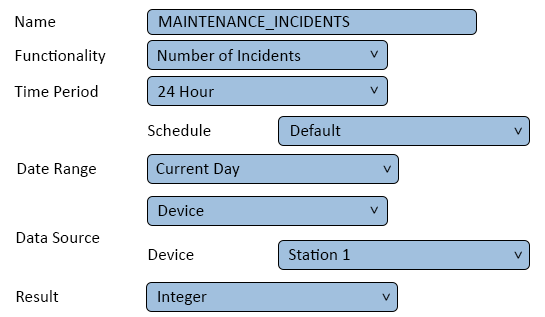
- Example - Device
- Returns the total Number of Incidents, on all Calls, for Station 1 in a 24 Hour period.
Keyword Search
| Type Subject or Key Word to Query Archives |
|---|

|