Difference between revisions of "VRS - Create a Shift Summary Report"
Jump to navigation
Jump to search
SupportAdmin (talk | contribs) |
SupportAdmin (talk | contribs) m (Text replacement - "https://www.linkedin.com/company/versacall-technologies-inc-/mycompany/" to "https://www.linkedin.com/company/versacall/") |
||
| (8 intermediate revisions by the same user not shown) | |||
| Line 1: | Line 1: | ||
{|style="background:transparent; color:black" border="0" height="230" align="center" valign="bottom" | |||
|+style="background:transparent| | |||
|-align="center" | |||
File: | | | ||
< | |[[Image:CallUsBtn.png|Call Now 858-677-6766]] | ||
| | |||
|[[Image:SubmitTckBtn.png|link=https://www.versacall.com/customer-support/service-ticket]] | |||
| | |||
|[[Image:EmailUsBtn.png|link=mailto:[email protected]?Subject=Help%20Needed%20Wiki&body=Type%20Message%20Here]] | |||
|} | |||
<br> | |||
---- | |||
---- | |||
<br> | |||
[[File:GeneralHeader.png]] | |||
<br> | |||
=Overview= | {|style="margin:left; width: 100px; background:#eaf3ff; padding:5px; border:2px solid #000000;" | ||
|- | |||
|<big>'''Overview'''</big> | |||
{|style="margin:left; width: 800px; background:#F0F0F0; padding:5px; border:2px solid #000000;" | |||
|valign="top" | | |||
|- | |||
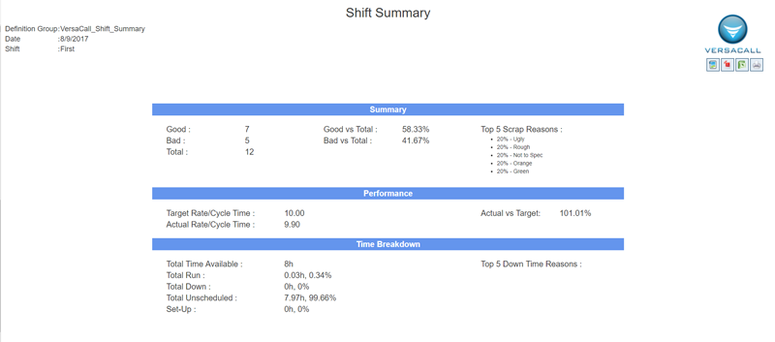
''' | |Reports generated with this template focus on showing all data related to the productivity of a shift(s). Data included on the report, Good Pcs., Bad Pcs., Cycle Time (Target vs Actual), Availability, Run Time, Downtime, Setup Time & Unscheduled Time.Review the Summary, Performance and Time Breakdown of the shift. This report requires a specific device configuration and a Definition Group assignment, please contact VersaCall Support for more information. Visit the New Report page [[VRS New Report|'''<u>Click Here'''</u>]] for more information on any individual step shown below. | ||
|} | |||
|} | |||
<br> | |||
''' | {|style="margin:left; width: 100px; background:#eaf3ff; padding:5px; border:2px solid #000000;" | ||
|- | |||
|<big>'''Requirements'''</big> | |||
= | {|style="margin:left; width: 800px; background:#F0F0F0; padding:5px; border:2px solid #000000;" | ||
|valign="top" | | |||
{| class="wikitable mw-collapsible mw-collapsed" width="775px;" | |||
|- | |||
'''1. | |style="text-align: center;" | '''See Requirements Here''' | ||
|- | |||
|'''1.''' The VT3000 Core Software installed and running on your system. | |||
|- | |||
|'''2.''' The VersaCall Reporting Software II (VRSII) installed and running on your system. | |||
|- | |||
|'''3.''' The Shift Summary Report template loaded in the VRS II Software. | |||
|} | |||
|} | |||
|} | |||
<br> | |||
{|style="margin:left; width: 100px; background:#eaf3ff; padding:5px; border:2px solid #000000;" | |||
|- | |||
|<big>'''Example'''</big> | |||
{|style="margin:left; width: 800px; background:#F0F0F0; padding:5px; border:2px solid #000000;" | |||
|valign="top" | | |||
< | |- | ||
|[[File:ProShift.png|center|775px]] | |||
< | |} | ||
|} | |||
<br> | |||
''' | ---- | ||
---- | |||
<br> | |||
[[File:InstructionHeader.png]] | |||
<br> | |||
{|style="margin:left; width: 100px; background:#eaf3ff; padding:5px; border:2px solid #000000;" | |||
|- | |||
|<big>'''Step 1.'''</big> | |||
{|style="margin:left; width: 800px; background:#F0F0F0; padding:5px; border:2px solid #000000;" | |||
|valign="top" | | |||
|- | |||
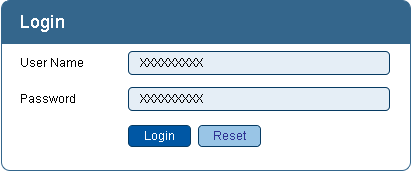
|Open the VT3000 web interface – select VRS II – log in with your username and password. | |||
{|style="margin:left;" | |||
|valign="top" | | |||
{|class="wikitable" style="background:white; align:center;" | |||
|- | |||
|[[File:UpTemp3.png|center|252px]] | |||
|} | |||
{|class="wikitable" style="background:white; align:center;" | |||
|- | |||
|[[File:UpTemp4.png|center|411px]] | |||
|} | |||
|} | |||
|} | |||
|} | |||
<br> | |||
---- | |||
<br> | |||
{|style="margin:left; width: 100px; background:#eaf3ff; padding:5px; border:2px solid #000000;" | |||
|- | |||
= | |<big>'''Step 2.'''</big> | ||
{|style="margin:left; width: 800px; background:#F0F0F0; padding:5px; border:2px solid #000000;" | |||
|valign="top" | | |||
|- | |||
|On the VRS II home page select the Create A New Report button in the right corner below the heading. | |||
{|style="margin:left;" | |||
|valign="top" | | |||
{|class="wikitable" style="background:white; width:775;" | |||
[[ | |- | ||
|[[File:VRS1.png|center|760px]] | |||
|} | |||
|} | |||
|} | |||
|} | |||
<br> | |||
---- | |||
<br> | |||
{|style="margin:left; width: 100px; background:#eaf3ff; padding:5px; border:2px solid #000000;" | |||
|- | |||
|<big>'''Step 3.'''</big> | |||
{|style="margin:left; width: 800px; background:#F0F0F0; padding:5px; border:2px solid #000000;" | |||
|valign="top" | | |||
|- | |||
|On Step 1 - Category - select Production. | |||
{|style="margin:left;" | |||
|valign="top" | | |||
{|class="wikitable" style="background:white; align:center;" | |||
|- | |||
|[[File:VRS46.png|center|140px]] | |||
|} | |||
|} | |||
|} | |||
|} | |||
<br> | |||
---- | |||
<br> | |||
{|style="margin:left; width: 100px; background:#eaf3ff; padding:5px; border:2px solid #000000;" | |||
|- | |||
|<big>'''Step 4.'''</big> | |||
{|style="margin:left; width: 800px; background:#F0F0F0; padding:5px; border:2px solid #000000;" | |||
|valign="top" | | |||
|- | |||
|On Step 2 - Template - select Shift Summary. | |||
{|style="margin:left;" | |||
|valign="top" | | |||
{|class="wikitable" style="background:white; align:center;" | |||
|- | |||
|[[File:Prod5.png|center|140px]] | |||
|} | |||
|} | |||
|} | |||
|} | |||
<br> | |||
---- | |||
<br> | |||
{|style="margin:left; width: 100px; background:#eaf3ff; padding:5px; border:2px solid #000000;" | |||
|- | |||
|<big>'''Step 5.'''</big> | |||
{|style="margin:left; width: 800px; background:#F0F0F0; padding:5px; border:2px solid #000000;" | |||
|valign="top" | | |||
|- | |||
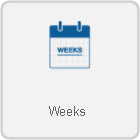
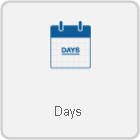
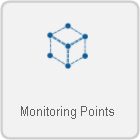
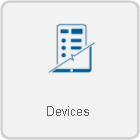
|On Step 3 - Variant - select the appropriate variant that applies to your needs. Click on any one of the icons below for an explanation of that specific variant. All variants are being shown below, some templates may not have one or more of the variants shown because they do not apply to the template being run. | |||
{|style="margin:left;" | |||
|valign="top" | | |||
{|class="wikitable" style="background:white; align:center; width:775px;" | |||
|- | |||
|[[File:Vmonth.png|center|140px|link=VRS - Month Variant]] || [[File:Vweeks.png|center|140px|link=VRS - Week Variant]] || [[File:Vdays.png|center|140px|link=VRS - Day Variant]] | |||
|- | |||
|style="text-align:center" | Data will display by Month. || style="text-align:center" | Data will display by Week. || style="text-align:center" | Data will display by Day. | |||
|} | |||
{|class="wikitable" style="background:white; align:center; width:775px;" | |||
|- | |||
|[[File:Vmonitor.png|center|140px|link=VRS - Monitoring Point Variant]] || [[File:Vdevice.png|center|140px|link=VRS - Device Variant]] || [[File:Vdata.png|center|140px|link=VRS - Data Variant]] | |||
|- | |||
|style="text-align:center" | Data will display by Monitoring Point. || style="text-align:center" | Data will display by Device Name. || style="text-align:center" | Data will display by Data Field Name. | |||
|} | |||
{|class="wikitable" style="background:white; align:center; width:775px;" | |||
|- | |||
|[[File:Vshift.png|center|140px|link=VRS - Shift Variant]] || [[File:Vtab.png|center|140px|link=VRS - Tabular Variant]] || [[File:Vgroup.png|center|140px|link=VRS - Group Variant]] | |||
|- | |||
|style="text-align:center" | Data will display by Shift. || style="text-align:center" | Data will display as Excel type sheet. || style="text-align:center" | Data will display by Group Name. | |||
|} | |||
|} | |||
|} | |||
|} | |||
<br> | |||
---- | |||
<br> | |||
{|style="margin:left; width: 100px; background:#eaf3ff; padding:5px; border:2px solid #000000;" | |||
|- | |||
|<big>'''Step 6.'''</big> | |||
{|style="margin:left; width: 800px; background:#F0F0F0; padding:5px; border:2px solid #000000;" | |||
|valign="top" | | |||
|- | |||
|Step 4 - Date Range - select one of the options available that meet your needs. | |||
{|style="margin:left;" | |||
|valign="top" | | |||
{|class="wikitable" style="background:white; align:center; width:775px;" | |||
|- | |||
|[[File:DataDate.png|center|709px]] | |||
|- | |||
|'''Dates''' - select Dates from the Interval field - select/enter the Date in the From & To fields. | |||
|} | |||
{|class="wikitable" style="background:white; align:center; width:775px;" | |||
|- | |||
|[[File:DataWeek.png|center|698px]] | |||
|- | |||
|'''Weeks''' - select Weeks from the Interval field - select the Year in the From & To fields - select the Week in the From & To fields. | |||
|} | |||
{|class="wikitable" style="background:white; align:center; width:775px;" | |||
|- | |||
|[[File:DataMonth.png|center|710px]] | |||
|- | |||
|'''Months''' - select Months from the Interval field - select the Year in the From & To fields - select the Month in the From & To fields. | |||
|} | |||
{|class="wikitable" style="background:white; align:center; width:775px;" | |||
|- | |||
||[[File:DataYear.png|center|699px]] | |||
|- | |||
|'''Years''' - select Years from the Interval field - select the Year in the From & To fields. | |||
|} | |||
|} | |||
|} | |||
|} | |||
<br> | |||
---- | |||
<br> | |||
{|style="margin:left; width: 100px; background:#eaf3ff; padding:5px; border:2px solid #000000;" | |||
|- | |||
|<big>'''Step 7.'''</big> | |||
{|style="margin:left; width: 800px; background:#F0F0F0; padding:5px; border:2px solid #000000;" | |||
|valign="top" | | |||
|- | |||
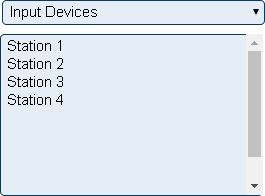
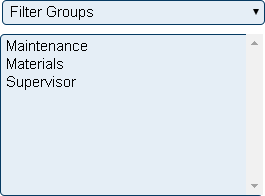
|Step 5 - Data Source - select the devices or filter groups for the data compiled on the report. | |||
{|style="margin:left;" | |||
|valign="top" | | |||
{|class="wikitable" style="background:white; align:center; width:775px;" | |||
|- | |||
|[[File:DataEver.png|center|263px]] | |||
|- | |||
|'''Everything''' - select Everything from the Type field. No further selections needed. | |||
|} | |||
{|class="wikitable" style="background:white; align:center; width:775px;" | |||
|- | |||
|[[File:DataInput.png|center|265px]] | |||
|- | |||
|'''Input Devices''' - select Input Devices from the Type field. Select one or more devices from the list. | |||
|} | |||
{|class="wikitable" style="background:white; align:center; width:775px;" | |||
|- | |||
|[[File:DataFilter.png|center|265px]] | |||
|- | |||
|'''Filter Groups''' - select Filter Groups from the Type field. Select one or more filter groups from the list. | |||
|} | |||
|} | |||
|} | |||
|} | |||
<br> | |||
---- | |||
<br> | |||
{|style="margin:left; width: 100px; background:#eaf3ff; padding:5px; border:2px solid #000000;" | |||
|- | |||
|<big>'''Step 8.'''</big> | |||
{|style="margin:left; width: 800px; background:#F0F0F0; padding:5px; border:2px solid #000000;" | |||
|valign="top" | | |||
|- | |||
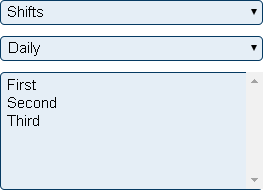
|Step 6 - Time Frame - select the amount of time to filter the data by. Depending on your previous selections, one or more of the options may not be available for selection. | |||
{|style="margin:left;" | |||
|valign="top" | | |||
{|class="wikitable" style="background:white; align:center; width:775px;" | |||
|- | |||
|[[File:RangeNone.png|center|263px]] | |||
|- | |||
|'''None''' - select None from the Type field - no further selections needed. This option will not filter the data, everything will be included within the Date Range selected previously. | |||
|} | |||
{|class="wikitable" style="background:white; align:center; width:775px;" | |||
|- | |||
|[[File:RangeFull.png|center|263px]] | |||
|- | |||
|'''Full Day''' - select Full Day from the Type field - select a Schedule from the Schedule field. Data will be filtered by the Start and End time of the Schedule selected. | |||
|} | |||
{|class="wikitable" style="background:white; align:center; width:775px;" | |||
|- | |||
|[[File:RangeShift.png|center|263px]] | |||
|- | |||
|'''Shifts''' - select Shifts from the Type field - select a Schedule from the Schedule field - select one or more Shifts from the Shifts list. Data will be filtered by the Shift(s) selected. | |||
|} | |||
{|class="wikitable" style="background:white; align:center; width:775px;" | |||
|- | |||
|[[File:RangeSpec.png|center|263px]] | |||
|- | |||
|'''Specified''' - select Specified from the Type field - enter a time in the From Time field and the To Time field. Data will be filtered by the From & To times entered. | |||
|} | |||
|} | |||
|} | |||
|} | |||
<br> | |||
---- | |||
<br> | |||
{|style="margin:left; width: 100px; background:#eaf3ff; padding:5px; border:2px solid #000000;" | |||
|- | |||
|<big>'''Step 9.'''</big> | |||
{|style="margin:left; width: 800px; background:#F0F0F0; padding:5px; border:2px solid #000000;" | |||
|valign="top" | | |||
|- | |||
|Step 7 - Options - each template will vary in the options available. An explanation of all possible options is shown below. | |||
{|style="margin:left;" | |||
|valign="top" | | |||
{|class="wikitable" style="background:white; align:center; width:775px;" | |||
|- | |||
|'''Report Title''' - This is the title that will shown on top of the generated report. Edit this field if needed. | |||
|- | |||
|'''Good Response Time''' - Enter a number of seconds to show as a good response time. Will show as a green background on the report. | |||
|- | |||
|'''Good Resolve Time''' - Enter a number of seconds to show as a good resolve time. Will show as a green background on the report. | |||
|- | |||
|'''Poor Response Time''' - Enter a number of seconds to show as a poor response time. Will show as a red background on the report. | |||
|- | |||
|'''Poor Resolve Time''' - Enter a number of seconds to show as a poor resolve time. Will show as a red background on the report. | |||
|- | |||
|'''Minimum Duration''' - Exclude any events with a duration (minutes) less than the time entered. Click in the field to enter a time in minutes. | |||
|- | |||
|'''Y-Axis Description''' - This is the title/description of the Y axis shown vertically on the left side of the graph. Edit this field if needed. | |||
|- | |||
|'''Y-Axis2 Description''' - This is the title/description of the second Y axis shown vertically on the right side of the graph. Edit this field if needed. | |||
|- | |||
|'''Monitoring Point''' - Select the down arrow in the Compare By field - select Monitoring Point. The report will compare bars/data by Monitoring Points. | |||
|- | |||
|'''Show Values''' - Select the down arrow in the Show Values filed - select Yes or No. Selecting Yes will show the value of the bar/date on the report. | |||
|- | |||
|'''Exclude Break Time''' - Select the down arrow in the Exclude Break Time field - select Yes or No. Time shown in the report data will Include/Not Include break time from the selected schedule. | |||
|- | |||
|'''Template Theme''' - Select the down arrow in the Template Theme field - select a Theme from the list. There will only be options available if you have created custom themes. | |||
|- | |||
|'''Stack Bar Segments''' - Select the down arrow in the Stack Bar Segments field - select Yes or No. If you have selected to show multiple types of data, the results will appear as a stacked bar. | |||
|} | |||
{|class="wikitable" style="background:white; align:center; width:775px;" | |||
|- | |||
|style="text-align:center" | '''Compare By Option''' | |||
|- | |||
|'''None''' - Select the down arrow in the Compare By field - select None. This is the default setting, bars and data will appear normally with no comparison. | |||
|- | |||
|'''Device''' – Select the down arrow in the Compare By field - select Device. The report will compare bars/data by Device(s). | |||
|- | |||
|'''Group''' - Select the down arrow in the Compare By field - select Group. The report will compare bars/data by Filter Group(s). This option will only work if you selected Filter Groups in Step 5 - Data Source. | |||
|- | |||
|'''Shift''' - Select the down arrow in the Compare By field - select Shifts. The report will compare bars/data by Shift. This option will only work if the Schedule you selected in Step 6 - Time Frame has shifts setup. | |||
|} | |||
{|class="wikitable" style="background:white; align:center; width:775px;" | |||
|- | |||
|style="text-align:center" | '''Chart Type Option''' | |||
|- | |||
|'''Bar Chart''' - Select the down arrow in the Chart Type field - select Bar Chart. Data will be presented in vertical bars. | |||
|- | |||
|'''Horizontal Bar Chart''' - Select the down arrow in the Chart Type field - select Horizontal Bar Chart. Data will be presented in horizontal bars. | |||
|- | |||
|'''Line Chart''' - Select the down arrow in the Chart Type field - select Line Chart. Data will be presented by individual lines. | |||
|} | |||
|} | |||
|} | |||
|} | |||
<br> | |||
---- | |||
<br> | |||
{|style="margin:left; width: 100px; background:#eaf3ff; padding:5px; border:2px solid #000000;" | |||
|- | |||
|<big>'''Step 10.'''</big> | |||
{|style="margin:left; width: 800px; background:#F0F0F0; padding:5px; border:2px solid #000000;" | |||
|valign="top" | | |||
|- | |||
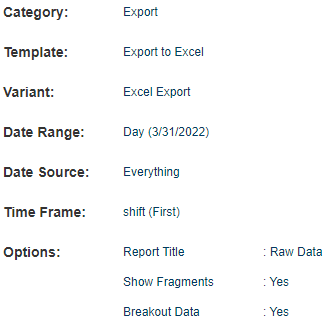
|Step 8 - Summary - A summary of all the options selected in the process will show on the screen (example shown below). Select the Run button in the top right corner to run the report. | |||
{|style="margin:left;" | |||
|valign="top" | | |||
{|class="wikitable" style="background:white; align:center;" | |||
|- | |||
|[[File:VRSStep8 1.png|center|329px]] | |||
|} | |||
|} | |||
|} | |||
|} | |||
<br> | |||
---- | |||
---- | |||
<br> | |||
{|style="margin:auto;" | |||
|+ | |||
[[File:RelatedHowTos.png|center]] | |||
|align="center" | | |||
{| class="wikitable mw-collapsible mw-collapsed" width="400px;" | |||
|- | |||
|style="text-align: center;" | '''Select a Guide Here''' | |||
|- | |||
|[[VRS - Create an Export to Excel Report|Run an Export to Excel Report]] | |||
|} | |||
|} | |||
<br> | |||
---- | |||
<br> | |||
{|style="margin:auto;" | |||
|+ | |||
[[File:SearchHeader.png|center]] | |||
|align="center" | | |||
{|class="wikitable" | |||
|- | |||
|<inputbox>type=search</inputbox> | |||
|} | |||
|} | |||
<br> | |||
---- | |||
<br> | |||
[[File:VC Footer.png|center]] | |||
{|style="background:transparent; color:black" border="0" height="200" align="center" valign="bottom" cellpadding=10px cellspacing=10px | |||
|+style="background:transparent| | |||
|-align="center" | |||
| | |||
|[[File:LinkedIn.png|Follow Us On LinkedIn|link=https://www.linkedin.com/company/versacall/]] | |||
| | |||
|[[File:BlogIcon.png|View our Blog|link=https://www.versacall.com/blog/]] | |||
|} | |||
Latest revision as of 19:24, 20 April 2023

|

|

|
Overview
|
Requirements
|
| Example
|
Step 1.
|
Step 2.
|
Step 3.
|
Step 4.
|
Step 5.
|
Step 6.
|
Step 7.
|
Step 8.
|
Step 9.
|
Step 10.
|
|
|
|

|

