Difference between revisions of "VRS New Report"
SupportAdmin (talk | contribs) |
SupportAdmin (talk | contribs) |
||
| Line 13: | Line 13: | ||
<gallery> | <gallery> | ||
VRS45.png | |||
VRS46.png | |||
VRS47.png | |||
VRS48.png | |||
VRS49.png | |||
</gallery> | </gallery> | ||
| Line 27: | Line 27: | ||
<gallery> | <gallery> | ||
Comm12.png | |||
Comm22.png | |||
Comm32.png | |||
</gallery> | </gallery> | ||
| Line 36: | Line 36: | ||
<gallery> | <gallery> | ||
Down1.png | |||
Down2.png | |||
Down3.png | |||
Down4.png | |||
Down5.png | |||
</gallery> | </gallery> | ||
| Line 47: | Line 47: | ||
<gallery> | <gallery> | ||
Prod1.png | |||
Prod2.png | |||
Prod3.png | |||
Prod4.png | |||
Prod5.png | |||
</gallery> | </gallery> | ||
| Line 58: | Line 58: | ||
<gallery> | <gallery> | ||
Ana1.png | |||
Ana2.png | |||
Ana3.png | |||
Ana4.png | |||
Ana5.png | |||
Ana6.png | |||
</gallery> | </gallery> | ||
| Line 70: | Line 70: | ||
<gallery> | <gallery> | ||
export.png | |||
</gallery> | </gallery> | ||
| Line 77: | Line 77: | ||
4. Step Three - select the Variant to be used on the report. | 4. Step Three - select the Variant to be used on the report. | ||
<gallery> | |||
Vdata.png|frame|left|link=VRS Data Variant|'''Data''' | |||
Vdays.png|frame|left|link=VRS Day Variant|'''Days''' | |||
Vdevice.png|frame|left|link=VRS Device Variant|'''Devices''' | |||
Vdist.png|frame|left|link=VRS Distribution Variant|'''Distribution''' | |||
Vgroup.png|frame|left|link=VRS Group Variant|'''Groups''' | |||
Vhours.png|frame|left|link=VRS Hour Variant|'''Hours''' | |||
Vmonitor.png|frame|left|link=VRS Monitoring Point Variant|'''Monitoring Points''' | |||
Vmonth.png|frame|left|link=VRS Month Variant|'''Months''' | |||
Vshift.png|frame|left|link=VRS Shift Variant|'''Shifts''' | |||
Vtab.png|frame|left|link=VRS Tabular Variant|'''Tabular''' | |||
Vweeks.png|frame|left|link=VRS Week Variant|'''Weeks''' | |||
</gallery> | |||
5. Step Four - select the Date Range for the report. | 5. Step Four - select the Date Range for the report. | ||
Revision as of 21:16, 4 October 2017
Create A Report
After selecting to Create New Report on the VRS main page, the user will see 8 steps. These steps are the same for any report, only the options in the steps change based on the template selected.
Steps for Creating a New Report
1. On the main page, in the Available Reports section, select the Create a New Report button.
![]()
2. Step One - select the Category of the template, there are 5.


3. Step Two - select the specific Template, there will be different options based on the category selected
Communications


Down Time


Production


Analytics


Export

4. Step Three - select the Variant to be used on the report.
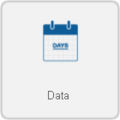
Data
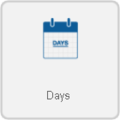
Days
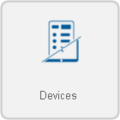
Devices

Distribution
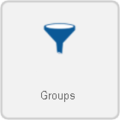
Groups

Hours
Monitoring Points
Months
Shifts
Tabular
Weeks
5. Step Four - select the Date Range for the report.
    a. Dates - select the specific From and To date from a calendar.
    b. Weeks - select the From and To year - select the From and To week of the year.
    c. Moths - select the From and To year - select the From and To month of the year.
    d. Years - select the From and To year.
6. Step Five - select the source of data for the report.
    a. Everything - report will include all input devices.
    b. Input Devices - using the list, select the device(s) to be included in the report.
    c. Filter Groups - using the list, select the group(s) to be included in the report.
7. Step Six - select the Time Frame.
    a. None - all hours in the date range will be included.
    b. Full Day - select the Schedule - all hours between Start of day and End of day will be included.
    c. Shifts - select the Schedule - select the shifts to include in the date range.
    d. Specified - enter the From Time and the To Time - only the hours in that range will be included.
8. Step 7 - depending on the template there will be multiple options available.
    a. Report Title - enter a name for the report or leave as default.
    b. Good Response Time - enter a number of seconds to show as a good response time.
    c. Poor Response Time - enter a number of seconds to show as a poor response time.
    d. Good Resolve Time - enter a number of seconds to show as a good resolve time.
    e. Poor Resolve Time - enter a number of seconds to show as a poor resolve time.
    f. Minimum Duration - enter the number of seconds the duration must be to show on the report.
    g. Y Axis Description - enter a name for the Y axis values on the left side of the graph.
    h. Y Axis 2 Description - enter a name for the Y axis values on the right side of the graph.
    i. Show Value - select to show the values, of the bars on the graph, or to hide them.
    j. Exclude Break Time -  select to include or exclude the break time in the report.
    k. Template Theme -  if a theme has been created, it can be selected in this field.