VRS New Report
Create A Report
After selecting to Create New Report on the VRS main page, the user will see 8 steps. These steps are the same for any report, only the options in the steps change based on the template selected.
Options When Creating a New Report
1. On the main page, in the Available Reports section, select the Create a New Report button.
2. Step One - select the Category of the template, there are 5.
3. Step Two - select the specific Template, there will be different options based on the category selected
Communications
Down Time
Production
Analytics
Export
4. Step Three - select the Variant to be used on the report.
5. Step Four - select the Date Range for the report.
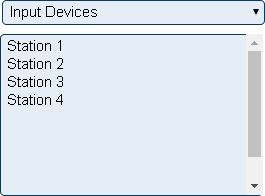
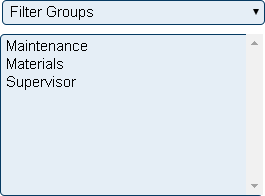
6. Step Five - select the source of data for the report.
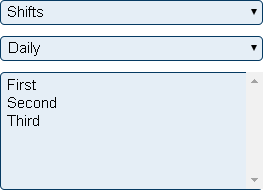
7. Step Six - select the Time Frame.
8. Step 7 - depending on the template there will be multiple options available.
    a. Report Title - enter a name for the report or leave as default.
    b. Good Response Time - enter a number of seconds to show as a good response time.
    c. Poor Response Time - enter a number of seconds to show as a poor response time.
    d. Good Resolve Time - enter a number of seconds to show as a good resolve time.
    e. Poor Resolve Time - enter a number of seconds to show as a poor resolve time.
    f. Minimum Duration - enter the number of seconds the duration must be to show on the report.
    g. Y Axis Description - enter a name for the Y axis values on the left side of the graph.
    h. Y Axis 2 Description - enter a name for the Y axis values on the right side of the graph.
    i. Show Value - select to show the values, of the bars on the graph, or to hide them.
    j. Exclude Break Time -  select to include or exclude the break time in the report.
    k. Template Theme -  if a theme has been created, it can be selected in this field.
Step by Step Guides
Create an Average Resolve Time Report
Create an Average Response Time Report
Create a Downtime Barchart Report
Create a Downtime Break Down Report
Create a Downtime Percent Report
Create a Downtime Pie Chart Report
Create a Downtime by Reason Code Report
Create an Equipment Timeline Report
Create an Export to Excel Report
Create a Number of Incidents Report
Create an Output Bar Chart Report
Create a Performance Cycle Time Report
Create a Performance Output Report
Create a Performance Rate Report
Create a Scrap by Reason Code Report


