Call Support at 858-677-6766 ext. 210
Overview
|
|
| After selecting to Create New Report on the VRS main page, the user will see 8 steps. These steps are the same for any report, only the options in the steps change based on the template selected.
|
|
Steps & Options
Step 1
|
|
| Select the Category/Group of the template you wish to use.
|
| Click on one of the Category/Group Icons for an overview of the templates available in that group.
|
|
Step 2
|
|
| Select the Specific Template to be used, there will be different options based on the category selected.
|
Click on one of the Icons for an image/example of the report.
| Downtime Reports
|
|
 |
|
|
|
| Production Reports
|
|
 |
|
|
|
|
|
|
Step 3
|
|
| Select the Variant (how data will be displayed) to be used on the report.
|
| Click on one of the Icons for an explanation of the Variant.
|
|
Step 4
|
|
Select the Date Range to be used on the report.
|
|
| Dates - select the specific From and To date from a calendar.
|
|
|
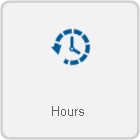
| Weeks - select the From and To year - select the From and To week of the year.
|
|
|
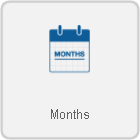
| Months - select the From and To year - select the From and To month of the year.
|
|
|
| Years - select the From and To year.
|
|
|
|
Step 5
|
|
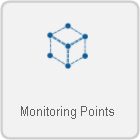
Select the Source (Devices) to be used on the report.
|
|
| Everything - report will include all input devices - no selection required. |
Input Devices - using the list, select the device(s) to be included in the report.
|
|
|
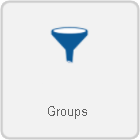
| Filter Groups - using the list, select the group(s) to be included in the report.
|
|
|
|
Step 6
|
|
Select the Time Frame, based on a Schedule or Shift(s), to be used on the report.
|
|
| None - data will not be filtered by time - no selection required. |
Full Day - select the Schedule - data will be filtered by Start of day until the End of day.
|
|
|
| Shifts - select the Schedule - select the Shift(s) - data will be filtered by the shift(s) selected. |
Specified - enter the From & To time - data will be filtered by the times entered.
|
|
|
|
Step 7
|
|
Depending on the template selected, there will be multiple options available. Below is a description of each option.
| Report Title - enter a name for the report or leave as default.
|
| Good Response Time - enter a number of seconds to show as a good response time. Will show as a green background on the report.
|
| Poor Response Time - enter a number of seconds to show as a poor response time. Will show as a red background on the report.
|
| Good Resolve Time - enter a number of seconds to show as a good resolve time. Will show as a green background on the report.
|
| Poor Resolve Time - enter a number of seconds to show as a poor resolve time. Will show as a red background on the report.
|
| Minimum Duration - enter the number of seconds the duration must be to show on the report. Anything below this number will not show on the report.
|
| Y Axis Description - enter a name for the Y axis values on the left side of the graph.
|
| Y Axis 2 Description - enter a name for the Y axis values on the right side of the graph.
|
| Show Value - select to show the values, of the bars on the graph, or to hide them.
|
| Exclude Break Time - select to include or exclude the break time in the report.
|
| Template Theme - if a theme has been created, it can be selected in this field.
|
|
|
|
Step 8
|
|
A summary of all the options that were selected in the steps will be presented.
|
|
| This is an example of the summary. |
Select the Run button to run the report. Select the Prev button to go back and change the settings on a specific step.
|
|
|
|