Difference between revisions of "VPIV - Create a Performance Table Panel"
SupportAdmin (talk | contribs) (Created page with "=Performance Panel= A Performance Panel has the ability to populate any type of tag. Generally, these panels are used to display information about Touch Input Modules, Product...") |
SupportAdmin (talk | contribs) |
||
| Line 156: | Line 156: | ||
'''5.''' | '''5.''' Select the Operator Name cell for the first device. Select Tag as the type. Select the (Device Name) Employee tag. | ||
[[File: | [[File:2017-11-22 12 28 46-VP4 Table Editor.png]] | ||
'''6.''' After all tags are selected/setup the column will look similar to the example below. | |||
[[File:2017-11-22 12 29 04-VP4 Table Editor.png]] | |||
Revision as of 20:22, 22 November 2017
Performance Panel
A Performance Panel has the ability to populate any type of tag. Generally, these panels are used to display information about Touch Input Modules, Production Status Modules and Switch Contact Modules. The instructions below can be used for an Andon Panel or Andon Widget.
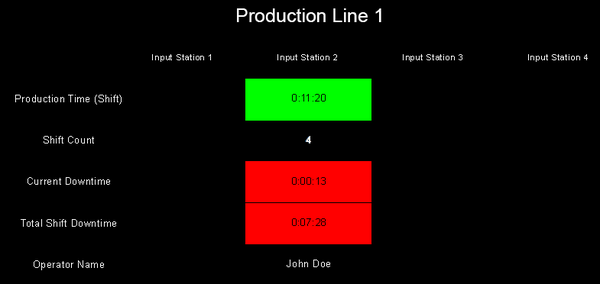
Example of a Performance Panel:
Panel Capabilities
A Performance Panel will accept/enable certain features.
1. Tags - Constant, State, Duration, Number of Incidents, Formula, Lookup, Count, Data Field, System Property & Configuration Property tags are available.
2. Widgets - Andon, Informative and Performance Widgets can be added to a Performance Panel.
3. URL - Not available.
4. Real-Time Report - Not available.
Getting Started
1. Select the Performance Table Panel/Widget icon from the Add New List.
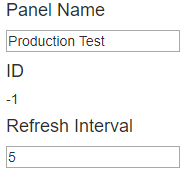
2. Enter an name for the panel/widget in the Panel/Widget Name field under the Properties tab. Leave the Refresh Interval at 5.
Tags
1. Select the Tags tab - select to Add a tag.
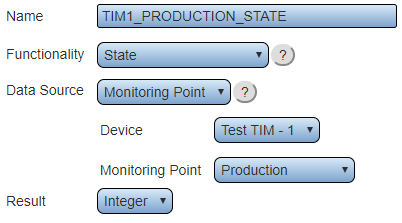
2. Create a State tag for Production on each device to be shown on the panel/widget. For more information on creating a State tag Click Here.
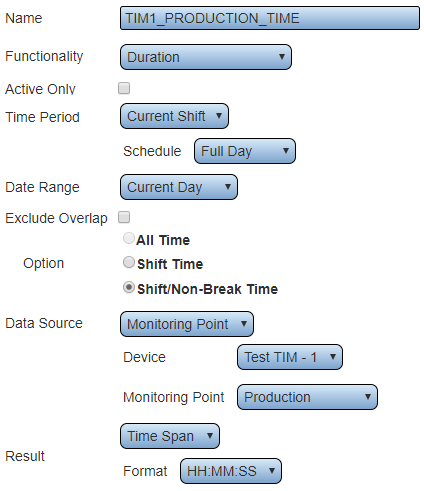
3. Create a Duration tag for Production on each device to be shown on the panel/widget. For more information on creating a Duration tag Click Here.
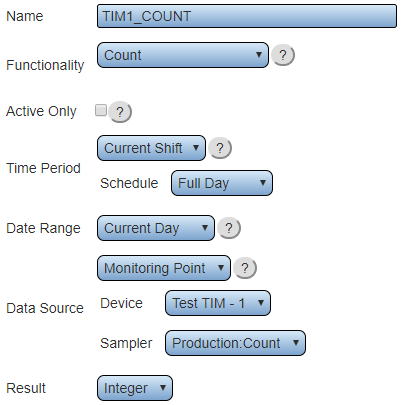
4. Create a Count tag for the Count on each device to be shown on the panel/widget. For more information on creating a Duration tag Click Here.
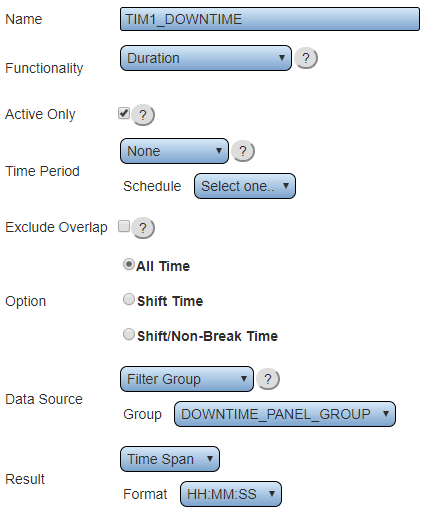
5. Create a Filter Group to include all the downtime alarms on a device. Create 1 group for each device. For more information on creating a Duration tag Click Here.
6. Create a Duration tag for the filter group (per device) created in step 5. This tag will calculate the Active Time only. For more information on creating a Duration tag Click Here.
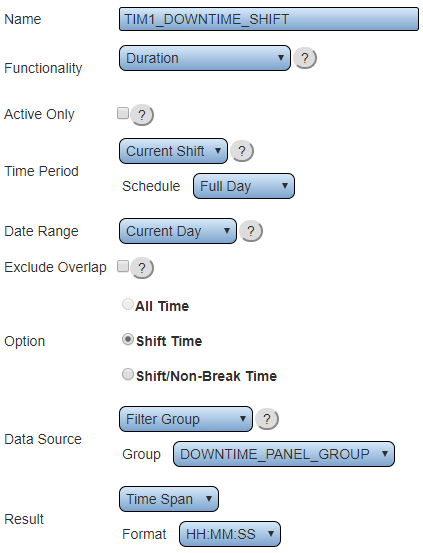
7. Create a Duration tag for the filter group (per device) created in step 5. This tag will calculate the Downtime for the Current Shift. For more information on creating a Duration tag Click Here.
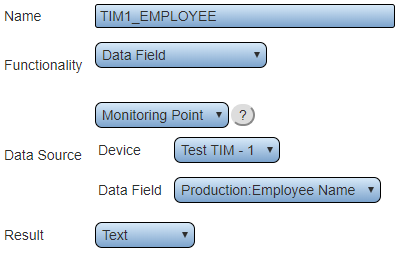
8. Create a Data Field tag for the Employee Name on each device to be shown on the panel/widget. For more information on creating a Duration tag Click Here
Layout
Headings
A panel/widget needs to have a heading or title across the top, a title column down the left side explaining what each row of information relates to (Count, Production, etc..) and a row of device names. NOTE: This is a simple performance panel setup used for instructional purposes. Users can change the look of the panel/widget according to need.
1. This panel will be for 4 modules with the same 5 performance data elements (Production Time (Shift), Shift Count, Current Downtime, Total Shift Downtime & Operator Name). Use the Rows & Column buttons to make 5 total columns and 7 total rows.
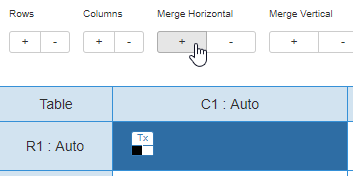
2. Select the R1 - C1 cell and use the Merge Horizontal (+) button to merge the top row. This will be our title/heading for the panel.
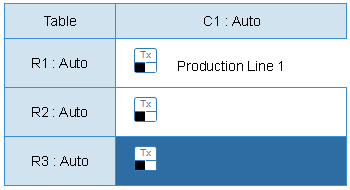
3. Use the Content field to enter the title/heading for the panel. Example below.
4. Select the R2 - C2 cell and use the Content field to enter the name of the first device that will be on the panel/widget. Repeat this for C3, C4 & C5 or the amount required. Example below.
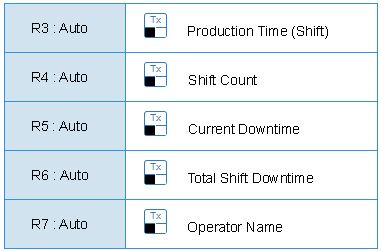
5. Select the R3 - C1 cell and use the Content field to enter the name of the first performance data element. Repeat the process for the other elements being shown on the panel/widget. Our example will have 5 elements (Production Time, Shift Count, Current Downtime, Total Shift Downtime and Operator Name).
Cell Setup
Each cell will show a specific tag according to the heading of the device and performance data element.
1. Select the Production Time (Shift) cell for the first device. Select Tag as the Type. Select the (Device Name) Production Time tag.
2. Select the Shift Count cell for the first device. Select Tag as the Type. Select the (Device Name) Count tag.
3. Select the Current Downtime cell for the first device. Select Tag as the Type. Select the (Device Name) Downtime tag.
4. Select the Total Shift Downtime cell for the first device. Select Tag as the Type. Select the (Device Name) Downtime Shift tag.
5. Select the Operator Name cell for the first device. Select Tag as the type. Select the (Device Name) Employee tag.
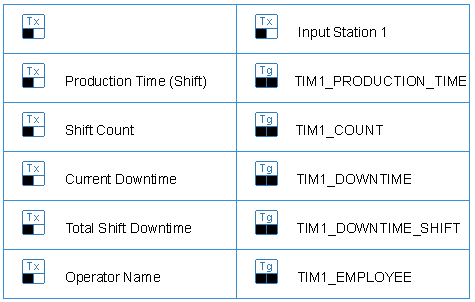
6. After all tags are selected/setup the column will look similar to the example below.
Cell Color
In some cases, the screen will need to be blank until data is available.
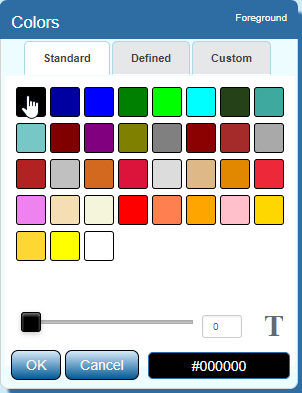
1. Select the Production Time (Shift) cell for the first device. Select the Fore color swatch. Select Black from the color pallet. This will make the cell black with no text when there is no data.
Conditions (Production Time)
The Production Time cell will have a green background with black text once the production on the device has been started.
1. Select the Production Time (Shift) cell for the first device.
2. Click on the Conditions button at the bottom of the page.
3. Select the Color tab.
4. Click on the Add Color Condition button.
5. In the Left Comparator field select the appropriate Production State tag for the device. Select the (>) sign from the middle field. Enter the number "0" in the Left Comparator field.
6. Click on the Back color swatch - select Green from the color pallet.
7. Click on the OK link when finished.
Conditions (Shift Count & Employee Name)
The Shift Count & Operator Name cells will have a black background with white text once production has been started on the device.
1. Select the Shift Count cell for the first device.
2. Click on the Conditions button at the bottom of the page.
3. Select the Color tab.
4. Click on the Add Color Condition button.
5. In the Left Comparator field select the appropriate Production State tag for the device. Select the (>) sign from the middle field. Enter the number "0" in the Left Comparator field.
6. Leave the color swatches set as default. Click on the OK link when finished.
7. Repeat the steps for the Operator Name cell.
Conditions (Current Downtime)
The Current Downtime cell will have a red background with black text when there is an alarm set on the device.
1. Select the Current Downtime cell for the first device.
2. Click on the Conditions button at the bottom of the page.
3. Select the Color tab.
4. Click on the Add Color Condition button.
5. In the Left Comparator field select the appropriate Downtime tag for the device. Select the (>) sign from the middle field. Enter the number "0" in the Left Comparator field.
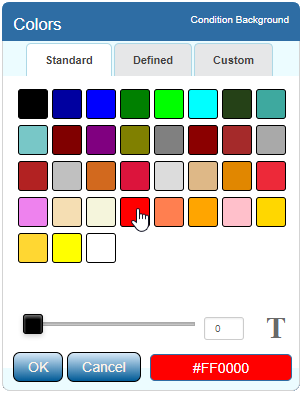
6. Click on the Back color swatch - select Red from the color pallet.
7. Click on the OK link when finished.
Conditions (Total Shift Downtime)
The Total Shift Downtime cell will have a red background with black text once downtime has accrued in the shift.
1. Select the Total Shift Downtime cell for the first device.
2. Click on the Conditions button at the bottom of the page.
3. Select the Color tab.
4. Click on the Add Color Condition button.
5. In the Left Comparator field select the appropriate Production State tag for the device. Select the (>) sign from the middle field. Enter the number "0" in the Left Comparator field.
6. Click on the Back color swatch - select Red from the color pallet.
7. Click on the OK link when finished.
Final Step
After all of the tags, headings, colors and conditions have been created, the panel layout will look similar to the example below.
